Keeping customers happy is vital for retention. Satisfied customers will likely stay loyal, leading to repeat purchases or services and positive word-of-mouth referrals. This would also attract more business. But satisfaction covers multiple touchpoints. For example, a company’s physical presence requires exceptional service and a pleasant atmosphere, among other things.
Meanwhile, user-friendly interfaces, regular updates, and attentive customer support demonstrate a competent website and software. However, a report from the US showed that in 2022, poor software quality cost businesses around $2.41 trillion in losses.
Improving your software’s user experience should be at the forefront of your development goals; hence, monitoring software quality metrics is vital. Don’t know where to start? Read this article!
What Are Software Quality Metrics?
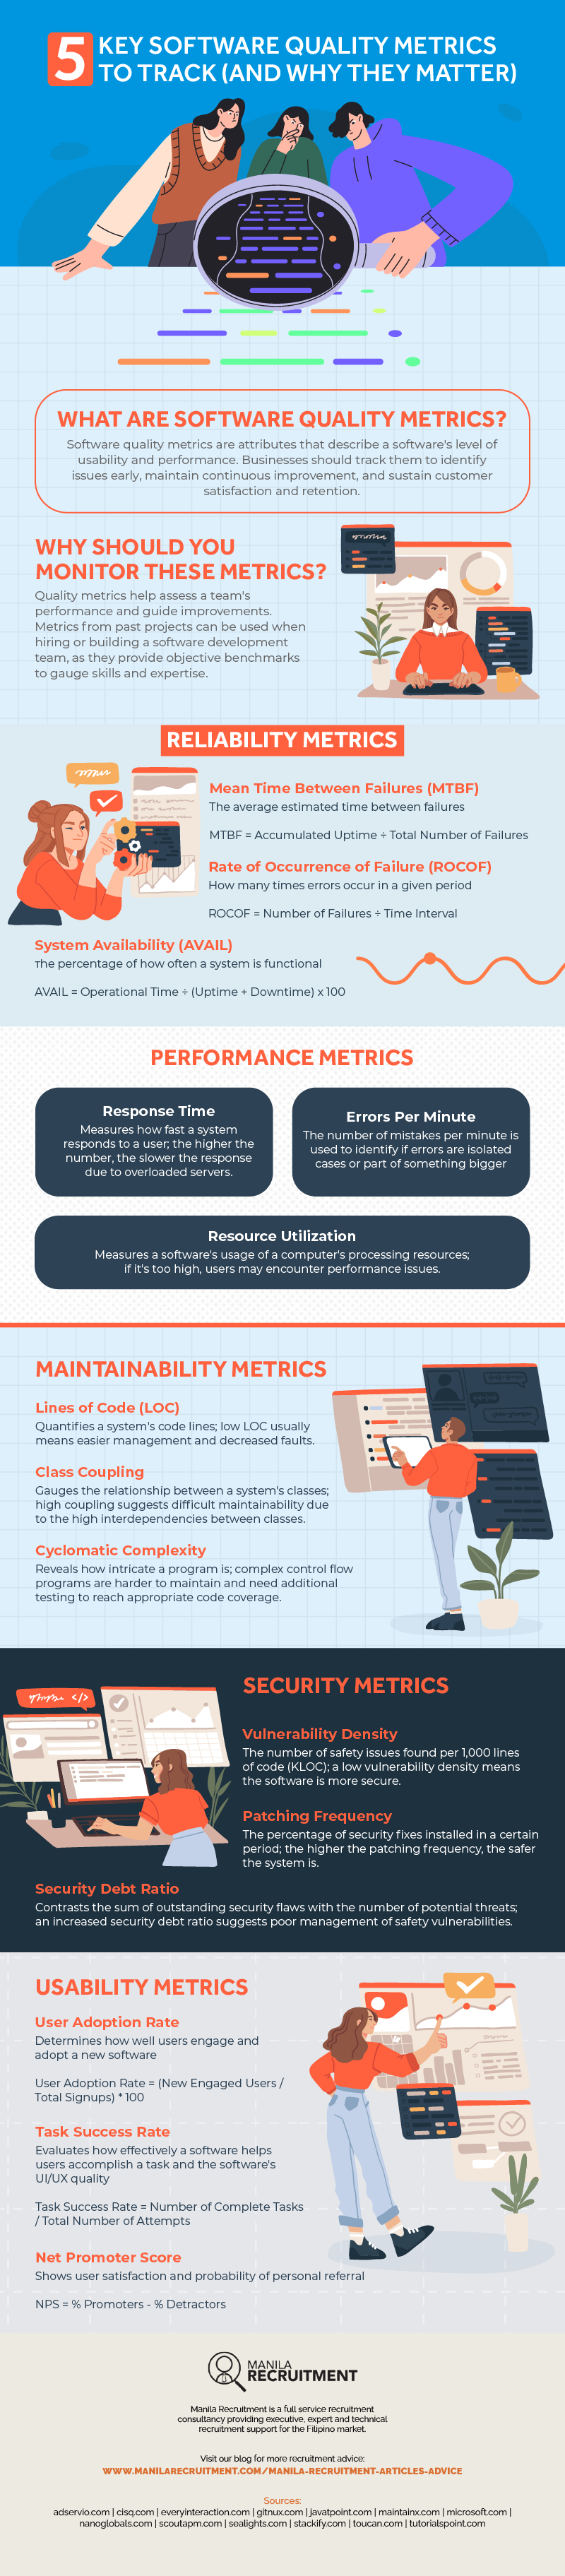
Software quality metrics are used to measure the attributes that describe a software’s level of usability and performance to assess various aspects of its development, identify potential issues, and examine the overall health of a project. It’s crucial to check these software quality KPIs or metrics to determine if your software provides a great user experience.
Why Should You Monitor These Metrics?
Quality metrics are incredibly valuable to various companies as they serve different purposes. For instance, while quality metrics help evaluate and proactively prevent problems with software performance, you can also utilize them to gauge how your team performs. They can check if your existing software development team needs to make changes or improvements for better output.
If you’re looking for an offshore software development team, you can ask the metrics from their previous projects to gauge their expertise and level of quality. A team that consistently meets or exceeds quality targets and has a reputation for providing reliable, high-quality software solutions will likely deliver successful projects.
These metrics are broadly divided into the following categories: readability, performance, maintainability, security, and usability.
5 Key Software Quality Metrics to Track
Here are the specific metrics you can track under the five categories mentioned.
1. Reliability
Reliability metrics describe the software’s dependability in terms of uptime and buggy-ness (or lack of it.) While many metrics can be tracked, here are the three most common ones useful for numerous industries.
Mean Time Between Failure (MTBF)
The MTBF is a reliability metric that assesses the expected average time between consecutive system breakdowns and measures the availability of the item under consideration.
To get the MTBF, divide the accumulated uptime by the total failures. Accumulated uptime is the total operating time of the software minus downtimes caused by failures and scheduled maintenance. Meanwhile, the total number of failures refers to breakdowns during the operation. Each time the item crashes or ceases to perform its intended function, it’s counted as one failure event.
Assuming you’re monitoring a software system for 1,000 hours, it encountered five failures.
MTBF = 1,000 hours / 5 failures
The MTBF for this software system is 200 hours. The system runs for approximately 200 hours on average before encountering a failure. A higher MTBF value indicates that the item is more dependable and less prone to frequent failures.
Rate of Occurrence of Failure (ROCOF)
The ROCOF analyzes the frequency of defects occurring in a system over a specific period. Unlike MTBF, ROCOF emphasizes the rate at which failures happen. To get the ROCOF, divide the number of failures by the given time interval.
For example, you observed a software system for 3,000 hours. In this time interval, there were nine failures.
ROCOF = 9 failures / 3,000 hours
The ROCOF is 0.003 failures per hour or one every 333 hours. A low ROCOF means that the system is stable. This can be useful for anticipating errors or scheduling system maintenance.
System Availability (AVAIL)
AVAIL is the percentage of time a system or service is operational and accessible to users during a given period. It reflects the system’s ability to perform its intended functions without experiencing downtime. To get the system availability rate, divide the total operational time by the designated period with downtime accounted for, then multiply the product by 100.
As an illustration, imagine you were supervising a system for 2,500 hours. But it was only operational for 2,000 hours (uptime), which means it had 500 hours of downtime due to failures, maintenance, etc.
AVAIL = 2,000 / (2,000 + 500) x 100
The availability for the system is 0.8, revealing that it’s functional at 80% during the monitoring period. System availability is typically expressed via percentage. Many organizations target a rate of five-nines, or an uptime of 99.999%.
2. Performance
The performance domain determines how well a product functions. These metrics help identify bottlenecks, performance issues, and opportunities for optimization. Continuous performance tracking allows you to meet requirements, deliver a smooth user experience, and efficiently utilize resources. Typically, these are automatically calculated by a system monitoring tool.
Response Time
Response time, expressed in milliseconds, is the duration between a user’s request and the application’s response. It assesses how quickly the software reacts to user actions. A low response time indicates a fast and efficient system, leading to a positive user experience. Conversely, a high response time can cause user frustration and reduced productivity.
Errors Per Minute
As the name suggests, this metric quantifies the frequency of faults in a software application within a timeframe. A low error-per-minute rate indicates good performance, while a high number suggests potential issues that need attention. Errors can occur as isolated cases or as a component of a larger problem, so it’s wise to monitor them to identify and resolve issues and ensure smooth operations.
Resource Utilization
This refers to how efficiently the software application uses its means, like CPU, memory, disk, and network. It measures the percentage of actively used resources to know if the application is optimized or experiencing inefficiencies. High resource utilization may lead to performance degradation and increased response times.
3. Maintainability
Maintainability gauges how easily a software system can be modified, updated, or repaired. It assesses code readability, complexity, and the presence of well-documented and organized code. High maintainability ensures that future changes can be made efficiently, reducing the likelihood of new defects. Usually, software QA testers run the software through code quality software to get these metrics.
Lines of Code (LOC)
The number of lines in a codebase may seem trivial, but it can indicate its size and complexity. A smaller codebase is generally easier to manage and maintain, while larger ones mean more room for errors.
Class Coupling
Class coupling is the interdependence between classes in a software system. High coupling can imply potential difficulties in maintaining and modifying the codebase, as changes in one class may have a ripple effect on others. Reducing class coupling enhances software maintainability, fostering a modular and loosely coupled design.
Cyclomatic Complexity
This measures the program’s density by counting the number of unique paths through its source code. It helps assess how intricate the code’s control flow is. A higher cyclomatic complexity value implies increased code complication, suggesting the need for refactoring to improve maintainability.
4. Security
Security appraises the protection a software system provides against potential threats. It involves checking security-related metrics, such as the number of incidents and the time taken to remedy issues.
Measuring security metrics can identify problematic areas, strengthen defense mechanisms, and ensure sensitive data’s confidentiality, integrity, and availability. These metrics can be taken by code quality software and cybersecurity experts.
Vulnerability Density
The vulnerability density metric quantifies the number of weaknesses in a software system, typically measured per thousand lines of code (KLOC). It provides critical insight into the software’s security strength, allowing you to identify and prioritize susceptible areas.
Reducing vulnerability density through proper testing, code reviews, and security measures help minimize the risk of exploits and enhance overall defense.
Patching Frequency
This metric measures how often a system receives updates to address security issues. A high patching frequency indicates proactive efforts to fix security problems promptly, reducing exposure to threats. But a low number may leave systems vulnerable to known exploits. Monitoring patching frequency allows you to assess responsiveness to security updates.
Security Debt Ratio
The ratio refers to the accumulation of unresolved safety issues and vulnerabilities in a software system over time. New cybersecurity threats appear daily, and companies must update their software’s security based on these latest findings. An elevated security debt ratio indicates a higher risk of potential security breaches and increased technical debt.
5. Usability
Usability evaluates how efficiently people can interact with a software application. A high usability score reveals a positive, user-friendly interface and experience. Assessing usability can help identify weak areas, enhance user productivity, and ensure the software meets the target audience’s demands and expectations.
User Adoption Rate
One of the most important metrics of software success is the number of people who have adopted and continuously used it after its introduction. It shows how well the software meets user needs and if it effectively fulfills its purpose.
A high user adoption rate suggests the application is easy to use and valuable, leading to increased engagement and satisfaction. Conversely, a low rate may indicate usability issues or little perceived value. To get the user adoption rate, divide the number of engaged users by the total number of signups, then multiply the product by 100.
For instance, if you have 20,000 installs since the introduction and still have an active 16,000 userbase, then:
User Adoption Rate = (16,000 / 20,000) x 100
The user adoption rate for the software application is 0.8, meaning 80% of the introduced users adopted the application.
Task Success Rate
The task success rate is the percentage of users who can complete specific actions within the software. It gauges how well users can achieve their goals using the application’s features. A high task success rate indicates the software is user-friendly and supports efficient task completion. Meanwhile, a low task success rate may signal the need for further optimizations.
To calculate this, simply divide the number of completed tasks by the total number of attempts. Assuming you conduct a usability test where 60 participants attempt to complete a task using a software application. However, only 20 were successful.
Task Success Rate = 20 / 60
The task success rate is 0.33, showing that 33% of the participants effectively completed the task, which suggests that you have significant improvements to do for your software’s UI and UX.
Net Promoter Score (NPS)
While more commonly used in marketing, NPS can also be used in software development. This quantifies user satisfaction and their likelihood to recommend the software to others. On a 0 to 10 scale, responses are grouped into three categories: Promoters (scores 9–10), Passives (scores 7–8), and Detractors (scores 0–6). The NPS is computed by subtracting the detractors’ percentage from the promoters’.
Suppose you surveyed 100 users about how likely they would recommend a software application to others. The results showed the following: Scores 9–10 = 70 (Promoters), Scores 7–8 = 20 (Passives), and Scores 0–6 = 10 (Detractors).
NPS = 70% – 10%
The net promoter score for the software application is 60. A positive NPS indicates high user satisfaction and advocacy, reflecting better usability and experience.
Turn to Software Quality Metrics
Using software quality metrics can significantly help your business grow in this changing and demanding time. That’s why it’s best to get your software development team on track to understand further how systems and processes work. Reliability, performance, maintainability, security, and usability—it’s a wide scope to uncover and evaluate.
Boost customer experience, satisfaction, and retention by proactively addressing issues and improvements. Moreover, doing so can save your company costs and time.
These metrics can also advance your recruitment strategies as they aid in selecting offshore teams and individual developers. They are vital in hiring and building successful software development teams, fostering a reputation for reliable, high-quality solutions.
If you need help finding remote and offshore IT workers, contact Manila Recruitment. They have a competent lineup of individuals ready to address your software development and update needs.